
Python & SQL - Stock Analysis
- Apr 17, 2022
- 1 min read
Updated: Apr 27, 2025
Description
‘stock-profile-funtern.csv’ is FUNTERN's stock archive data sample. In this dataset, we have basic information about codes of ‘stock’, different ‘sector’ names and ‘industry’ names and so on.
Analysis Tasks
1.a.How many exchanges are there (column P ‘exchange’)?
I found that there are 156 distinct exchanges in FUNTERN’s stock archive. (SQL)

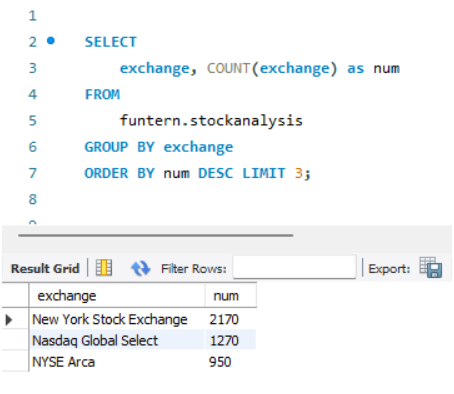
1.b. Which exchange has the most stocks?
As can be seen, ‘New York Stock Exchange’ has the most stocks. (SQL)
2. What's the average beta of each industry (column S = ‘sector’)?
From GROUPBY function, it’s obvious to tell that average beta values of these sectors
are between 0.5 and 2. (Python)

3.a.How many stocks don't have a CEO?
There are 2612 stocks don’t have a CEO. (Python)

3.b.For each stock that has CEO value missing, do they have a relatively big MktCap?
- Step 1: According to Market Capitalization Range (shown below),
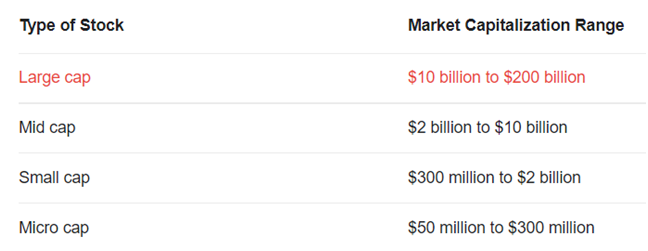
I defined a method to set 4 categories to describe ‘MktCap’ values:

- Step 2: Then I fill the missig ‘CEO’ as ‘N’ to show a sub-dataset when ‘CEO’ is empty.
Now we are able to check the types of MktCap’s values (‘small’, ‘around mean’
or ‘high’).

- Step 3: In the last step, I grouped the MktValue to see how many counts in each
catecory. As the table shown, about 2000 of MktVlue with missing CEO belong
to ‘Micro MktCap’ and ‘Small MktCap’, which is 10 times more than ‘Mid
MktCap’ and ‘Large MktCap’ respectively.

As a result, for stocks that has CEO value missing, they do not have a relatively big
Marketing Capitalization but have quite small Marketing Capitalization.
FUNTERN Associate: Junyu Fang
Comments